This article was originally published on Fool.com. All figures quoted in US dollars unless otherwise stated.
From time to time, Wall Street provides a not-so-subtle reminder to the investing community that stocks can move lower.
Since achieving their all-time closing highs between mid-November 2021 and the first week of January 2022, the ageless Dow Jones Industrial Average (DJINDICES: ^DJI), widely followed S&P 500 (SNPINDEX: ^GSPC), and growth stock-driven Nasdaq Composite (NASDAQINDEX: ^IXIC) have respectively plummeted by as much as 22%, 28%, and 38%. This means all three major U.S. indexes have had at least a brief taste of a bear market in 2022.
Regardless of how long you've been investing, bear markets can make you question your resolve to stay the course. In particular, the 2022 bear market has a lot of folks wondering where the bottom might be. Although no indicator, metric, or statistic has accurately predicted the start or finish of every bear market, one telltale bear market indicator does have an exceptionally strong track record of forewarning investors.
This bear market metric indicates more trouble is ahead for Wall Street
Looking back as far as 1870, the S&P 500 Shiller price-to-earnings (P/E) ratio has foretold the coming of five bear markets. The Shiller P/E, also known as the cyclically adjusted price-to-earnings ratio (CAPE ratio), takes into account inflation-adjusted earnings from the previous 10 years.
While on the surface the Shiller P/E is just another valuation tool, it's accurately predicted a coming bear market anytime it's crossed above 30 and sustained that level. This includes peaking above 30 in 1929 ahead of the Great Depression, topping out at 44 during the dot-com bubble, surpassing 30 in the third quarter of 2018 and just prior to the coronavirus crash, and once more (briefly) surpassing 40 during the first week of 2022. The short version is that anytime the S&P Shiller P/E ratio tops 30 during a bull market, a decline in the S&P 500 of at least 20% eventually follows (key word, "eventually").
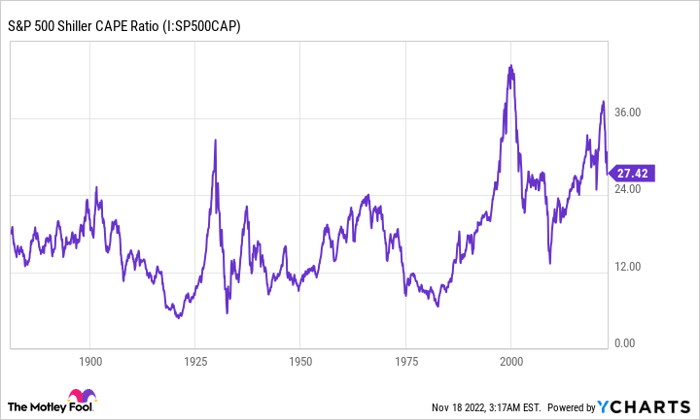
S&P 500 Shiller CAPE Ratio data by YCharts.
But the Shiller P/E ratio can be just as useful forecasting where a bear market will bottom. With the exception of the financial crisis (2007-2009), a number of double-digit percentage retracements in the S&P 500 over the past quarter of a century have found their bottom when the S&P 500 Shiller P/E hit 22 (give or take a point or two in each direction). This isn't all that surprising given that professional and everyday investors often become more critical of stock valuations during bear market declines.
I'm sorry to say, but this telltale bear market indicator is, once more, sounding a warning that the broader market has yet to find its bottom -- at least if history proves accurate. The latest bounce following a lower-than-anticipated U.S. inflation rate briefly pushed the S&P Shiller back above 29. Though anything is possible, no bear market has ever bottomed with the Shiller P/E as high as it is now.
Considering that a number of high-profile companies have begun to temper their outlooks, all signs would appear to point to a bumpy road for equities to end 2022 and/or begin 2023.
This "warning" is your opportunity to pounce
Although the S&P Shiller P/E ratio has a time-tested track record of being right, it's not perfect. But there is something that does have a perfect track record: The S&P 500 itself.
As I've previously pointed out, time is the greatest ally investors have. Trying to predict where the market will be a year from now is nothing more than a crapshoot. However, the longer you hold, the greater your chance of being correct and building wealth.
According to data compiled by market analytics company Crestmont Research, there's hasn't been a 20-year rolling period since 1900 where the S&P 500 has failed to deliver a positive total return, including dividends paid. In other words, if you hypothetically bought and held an S&P 500 tracking index for 20 years, you made money 103 out of 103 times (with every year from 1919 through 2021 representing the end years for these rolling 20-year periods). Most of the time, investors made a boatload of money, with more than 40% of these 103 end years resulting in an average annual total return of at least 10.8%.
If you're worried about "getting in too early," consider this: There have been 39 separate double-digit percentage declines in the S&P 500 since the beginning of 1950. With the exception of the current bear market, all 38 previous crashes, corrections, and bear markets were eventually cleared away by a bull market. Once again, it doesn't really matter when you buy, so long as you give your investment(s) ample time to play out and prove your thesis correct.
I should also state that this isn't unique to the S&P 500. Every crash, correction, and bear market in the Dow Jones Industrial Average and Nasdaq Composite were also eventually whisked away by bull markets.
In short, if the Shiller P/E ratio is sounding a warning, it's often a great time for opportunistic long-term investors to pounce.
This article was originally published on Fool.com. All figures quoted in US dollars unless otherwise stated.